New Paragraph
DAN COOPER GROUP
The Greater Toronto Area (GTA) housing market stands strong even in the face of challenging economic conditions. Over the past few months, there has been an uptick in home values, with a cumulative increase of $43,432, and a second consecutive monthly rise of $6,500. This puts the average GTA home price at $1,125,928, reflecting a year-over-year increase of $36,500. Among the various housing segments, the detached category continues to show strength, with a monthly increase of $9,326 and a year-over-year gain of $77,674.
While prices have not increased as much as they did earlier in 2023 and remain lower than the peak of March 2022, the resilience of the GTA market offers confidence to both prospective homebuyers and investors. It appears that the GTA housing market remains highly attractive and is resilient to the prevailing economic challenges.
“Competition between buyers remained strong enough to keep the average selling price above last year’s level in October and above the cyclical lows experienced in the first quarter of this year. The Bank of Canada also noted this resilience in its October statement. However, home prices remain well-below their record peak reached at the beginning of 2022, so lower home prices have mitigated the impact of higher borrowing costs to a certain degree,” said TRREB Chief Market Analyst Jason Mercer.
With more inventory available than in previous years, this fall and winter may be an excellent opportunity for prepared and qualified buyers to make their move. Economic data indicates that the Canadian economy is contracting and that inflation, while still higher than the Bank of Canada’s target, has also slowed in recent months. These factors reduce the likelihood that the Bank of Canada will raise rates again in the coming months, and we may even see an interest rate decrease in 2024. A stable or slightly lower interest rate environment will compel buyers to move off the sidelines, driving up competition for homes once again. As such, we may look back on the next six months as having been the best opportunity for homebuyers looking for more choice with less competition to have entered or moved up in the market.
The average selling price was $1,125,928 as compared to $1,119,428 the previous month. The average price is above last year’s average of $1,087,590. The average number of listing days on the market is up by 1 day to 21 as compared to 20 from the previous month. Total active listings were up 50.1% year-over-year, and new listings were up 38.0% year-over-year, from 10,433 in October 2022 to 14,397 in October 2023.
INSIGHTS
Oakville MARKET INSIGHTS
Market Insights
All property types
OCTOBER 2022
OCTOBER 2023
172
Homes Sold
-18.60%
140
Homes Sold
$1,487,485
Avg. Resale Price
-6.17%
$1,395,752
Avg. Resale Price
OCTOBER 2023 Stats
SALES
AVG PRICE
Detached
Semi-Detached
Townhouse
Condo Townhouse
Condo Apartment
73
3
23
10
27
$1,784,427
$1,078,296
$1,252,830
$757,100
$811,372
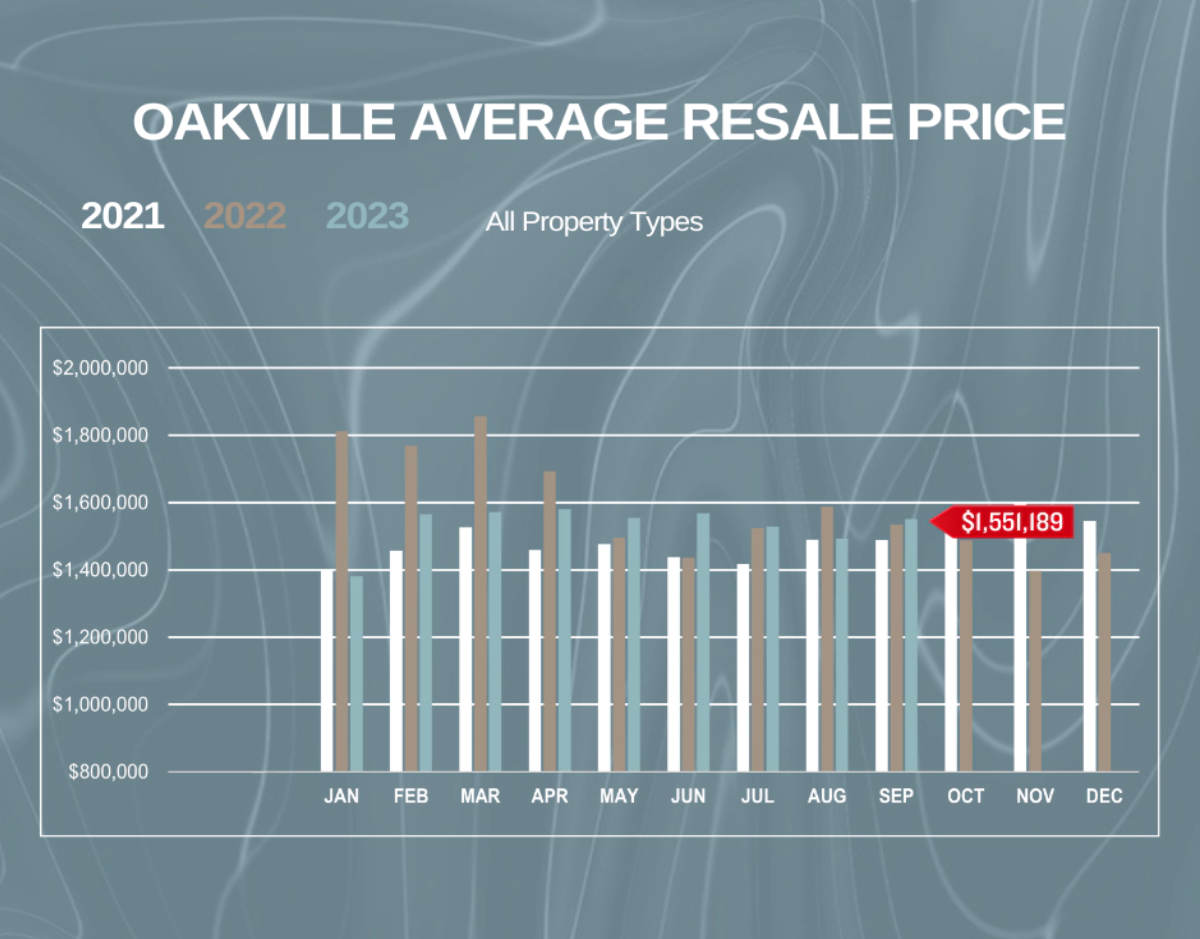
Oakville Average Resale Price
MISSISSAUGA MARKET INSIGHTS
Market Insights
All property types
OCTOBER 2022
OCTOBER 2023
446
Homes Sold
-6.28%
418
Homes Sold
$987,356
Avg. Resale Price
+12.04
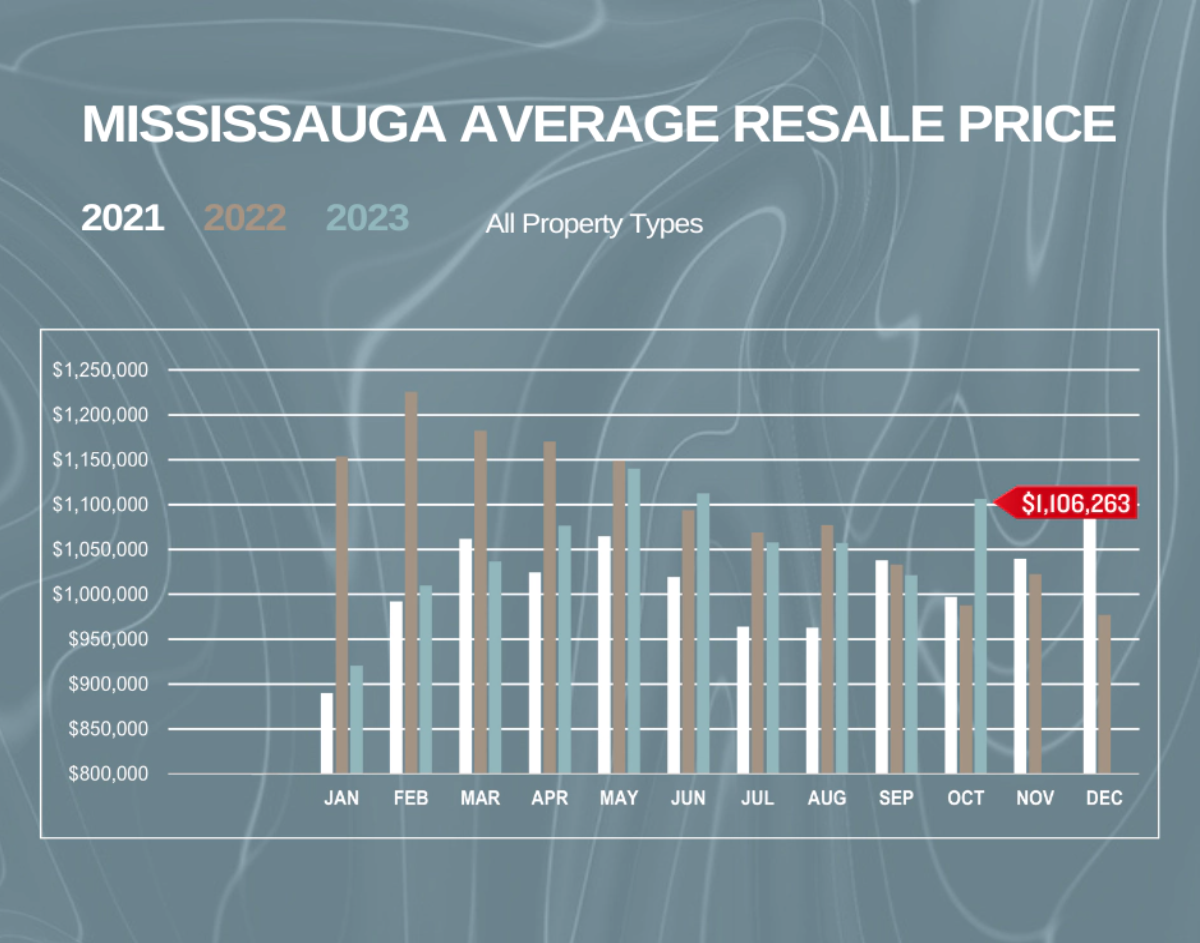
$1,106,26
Avg. Resale Price
october 2023 Stats
SALES
AVG PRICE
Detached
Semi-Detached
Townhouse
Condo Townhouse
Condo Apartment
175
47
18
75
102
$1,564,286
$980,912
$1,015,917
$791,564
$626,630
MISSISSAUGA Average Resale Price
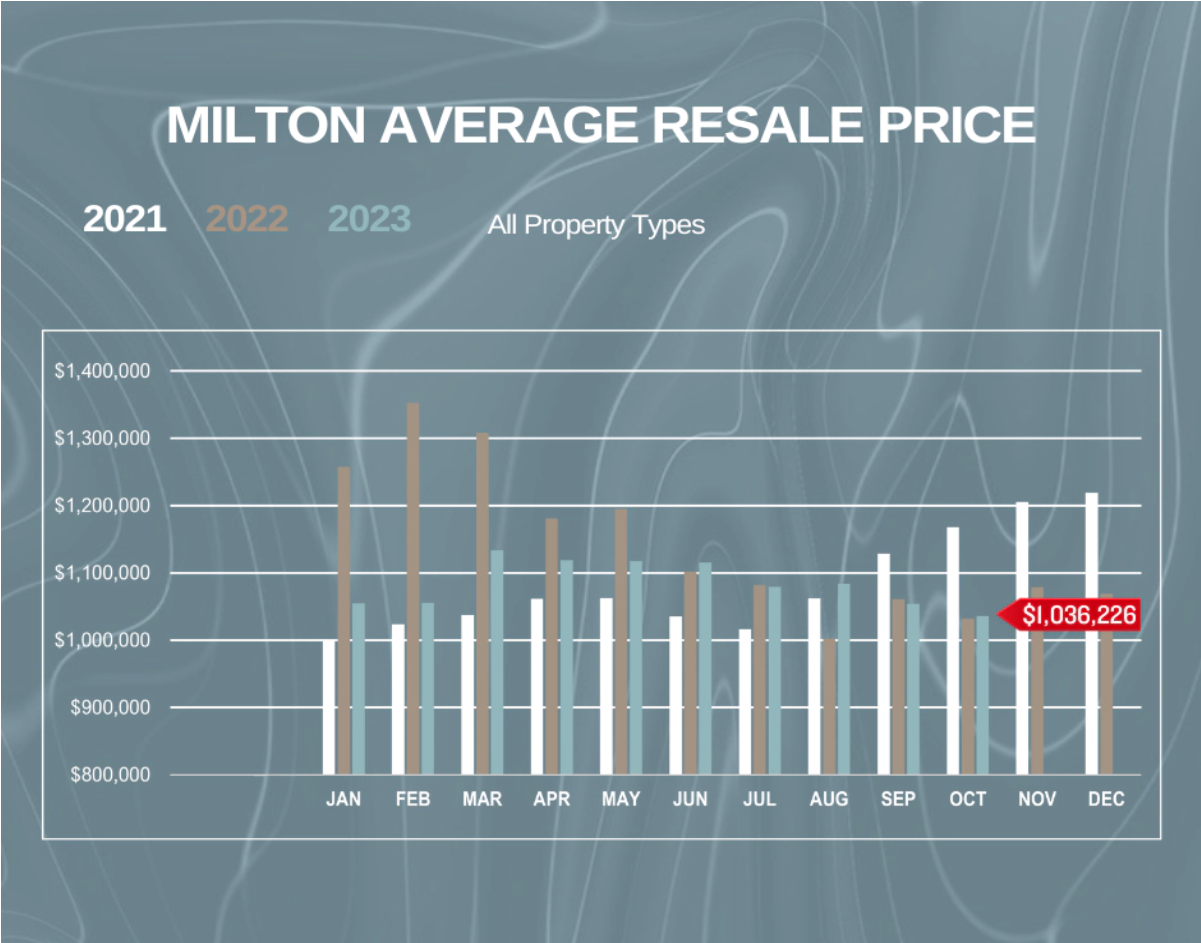
MILTON MARKET INSIGHTS
Market Insights
All property types
OCTOBER 2022
OCTOBER 2023
91
Homes Sold
+16.48%
106
Homes Sold
$1,031,770
Avg. Resale Price
+0.43%
$1,036,226
Avg. Resale Price
OCTOBER 2023 Stats
SALES
AVG PRICE
Detached
Semi-Detached
Townhouse
Condo Apartment
Condo Townhouse
37
12
35
7
14
$1,334,432
$1,009,042
$902,3342
$921,014
$652,044
MILTON Average Resale Price
BURLINGTON MARKET INSIGHTS
Market Insights
All property types
OCTOBER 2022
OCTOBER 2023
163
Homes Sold
-15.95%
137
Homes Sold
$1,130,048
Avg. Resale Price
+0.95%
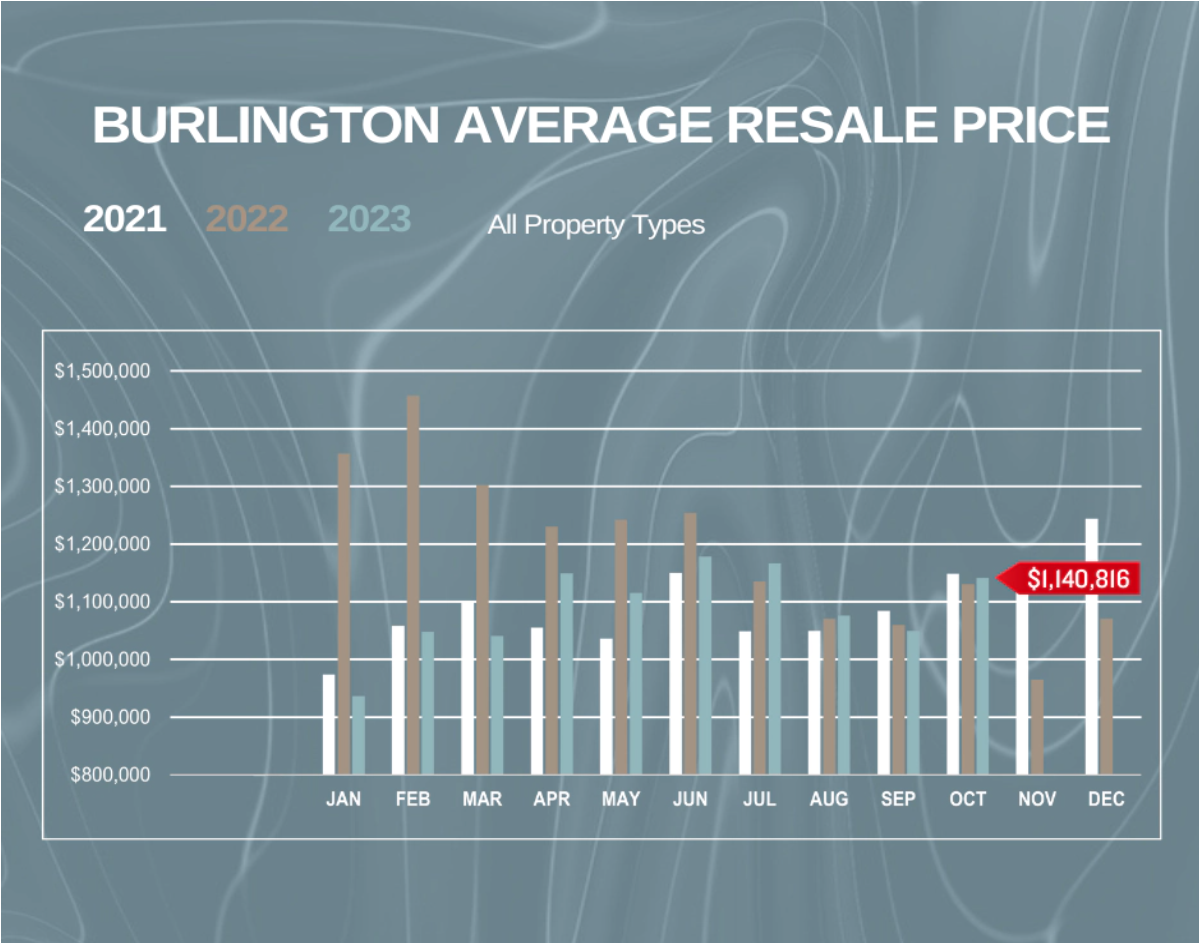
$1,140,816
Avg. Resale Price
OCTOBER 2023
SALES
AVG PRICE
Detached
Semi-Detached
Townhouse
Condo Townhouse
Condo Apartment
73
5
6
23
29
$1,455,498
$963,500
$1,065,250
$845,843
$625,759
BURLINGTON Average Resale Price
