DAN COOPER GROUP
As November concluded, the aggregate value of a GTA home remains at $1,082,179, mirroring last year’s figures. Despite an initial surge in the first half of the year, mid-year interest rate increases led to a temporary dip in home sale prices, marking the second-lowest point for home values in the year.
The surge in inventory appears to have slowed, possibly due to winter seasonality or subdued buyer and seller activity amid heightened borrowing costs. November’s total inventory reached 16,759 active listings, showing a monthly decrease of 2,781 but a year-over-year rise of 4,849 available properties for sale.
As economists commence speculating on potential interest rate cuts, possibly as early as next spring, discussions about when the market might reclaim its previously robust momentum have initiated. This concept is underscored in a recent article featured in the Globe and Mail. “Bay Street prognosticators are currently pricing in a full percentage point of rate cuts next year as Canada flirts with recession. Home prices have much precedent for rising during recessions, by the way. That’s because homebuyer incomes don’t dive all that much and buying power rises as rates drop. But consider this: if average mortgage rates fell merely one percentage point, all it would take to cancel out that nationwide affordability improvement would be a $63,000 bounce in the $656,625 price of an average home.
That kind of gain can happen in two months, as it did last spring. It was only 10 months ago when the Bank of Canada’s premature rate pause inspired homebuying enough to drive prices $74,167 higher in two months and $116,840 (19 per cent) higher in just four months. Part of that rise was because of a change in the types of homes purchased – what economists call the “composition effect” – but the point remains: low rates and low prices attract high demand.”
With stagnate sale prices and anticipated rate cuts, the current market offers buyers potentially the most favourable conditions in years. However, the likelihood of this opportune period lasting for an extended duration appears low.
In the GTA detached segment, monthly losses led to an average sale price of $1,403,500, still $61,652 above the lows of January. For the first time in 2023, inventory declined to 6,834, a 20% decrease from October. While the sales environment remained cautious, completing 1,881 sales marked a 42% decrease from the seasonal average over the preceding ten years.
For homeowners, delaying the search for the perfect deal may have repercussions. The prevailing wisdom suggests the time to buy is when a suitable property is found that fits one’s needs and affordability. With factors like immigration, housing supply constraints, and potential lower interest rates, the current period could be viewed as an opportune time to buy, with less competition compared to what may transpire in 2024.
INSIGHTS
Oakville MARKET INSIGHTS
Market Insights
All property types
NOVEMBER 2022
NOVEMBER 2023
155
Homes Sold
-11.61%
137
Homes Sold
$1,397,718
Avg. Resale Price
+12.47%
$1,572,012
Avg. Resale Price
November 2023 Stats
SALES
AVG PRICE
Detached
Semi-Detached
Townhouse
Condo Townhouse
Condo Apartment
77
2
18
15
25
$1,888,364
$1,102,500
$1,261,517
$778,133
$1,335,092
MISSISSAUGA MARKET INSIGHTS
Market Insights
All property types
NOVEMBER 2022
NOVEMBER 2023
409
Homes Sold
-7.82%
377
Homes Sold
$1,022,312
Avg. Resale Price
-2.83%
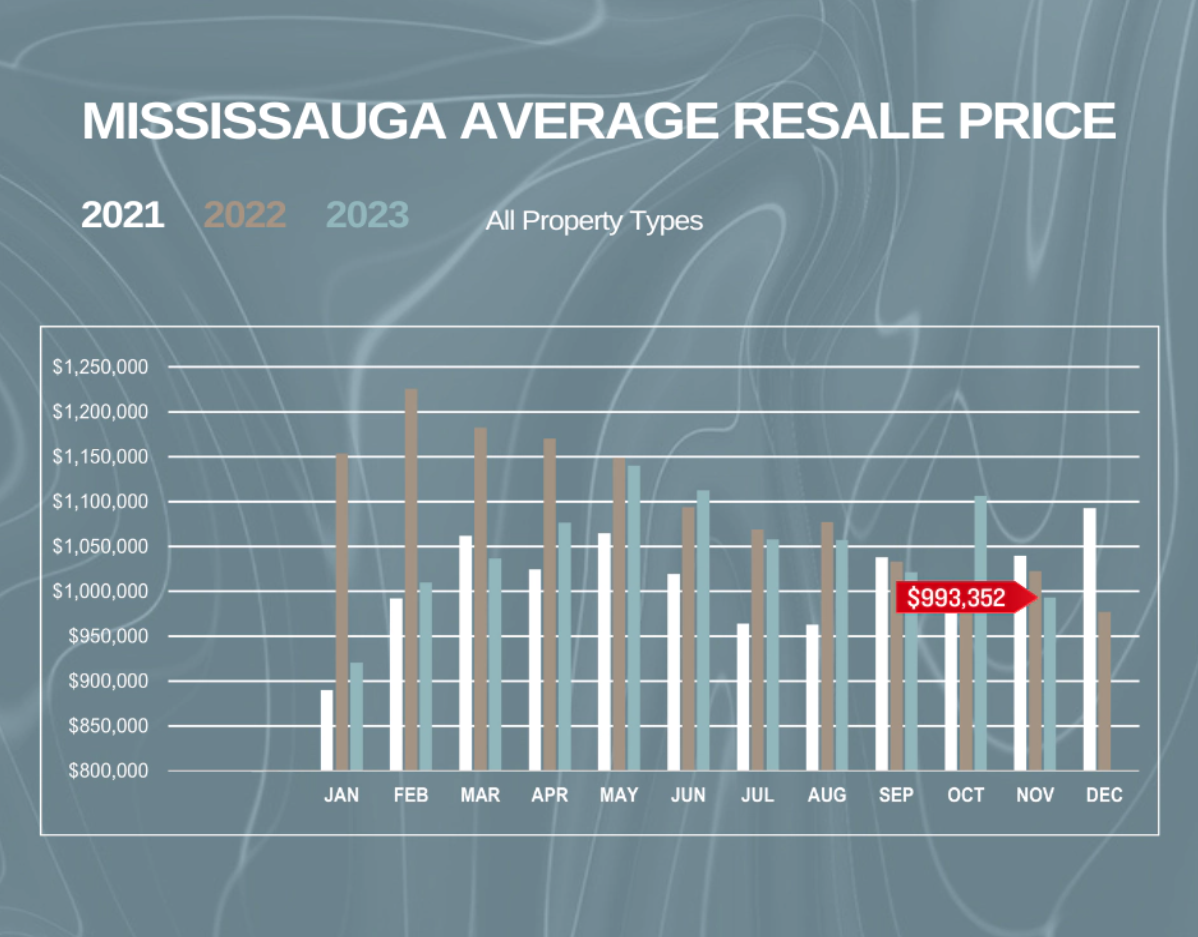
$993,352
Avg. Resale Price
november 2023 Stats
SALES
AVG PRICE
Detached
Semi-Detached
Townhouse
Condo Townhouse
Condo Apartment
126
53
15
77
106
$1,398,829
$1,056,765
$996,667
$764,399
$649,765
MISSISSAUGA Average Resale Price
MILTON MARKET INSIGHTS
Market Insights
All property types
NOVEMBER 2022
NOVEMBER 2023
91
Homes Sold
+8.79%
99
Homes Sold
$1,078,240
Avg. Resale Price
-3.36%
$1,041,949
Avg. Resale Price
November 2023 Stats
SALES
AVG PRICE
Detached
Semi-Detached
Townhouse
Condo Apartment
Condo Townhouse
47
13
23
7
9
$1,288,274
$942,154
$873,135
$671,586
$619,211
MILTON Average Resale Price

BURLINGTON MARKET INSIGHTS
Market Insights
All property types
NOVEMBER 2022
NOVEMBER 2023
135
Homes Sold
+8.15%
146
Homes Sold
$964,939
Avg. Resale Price
+5.97%
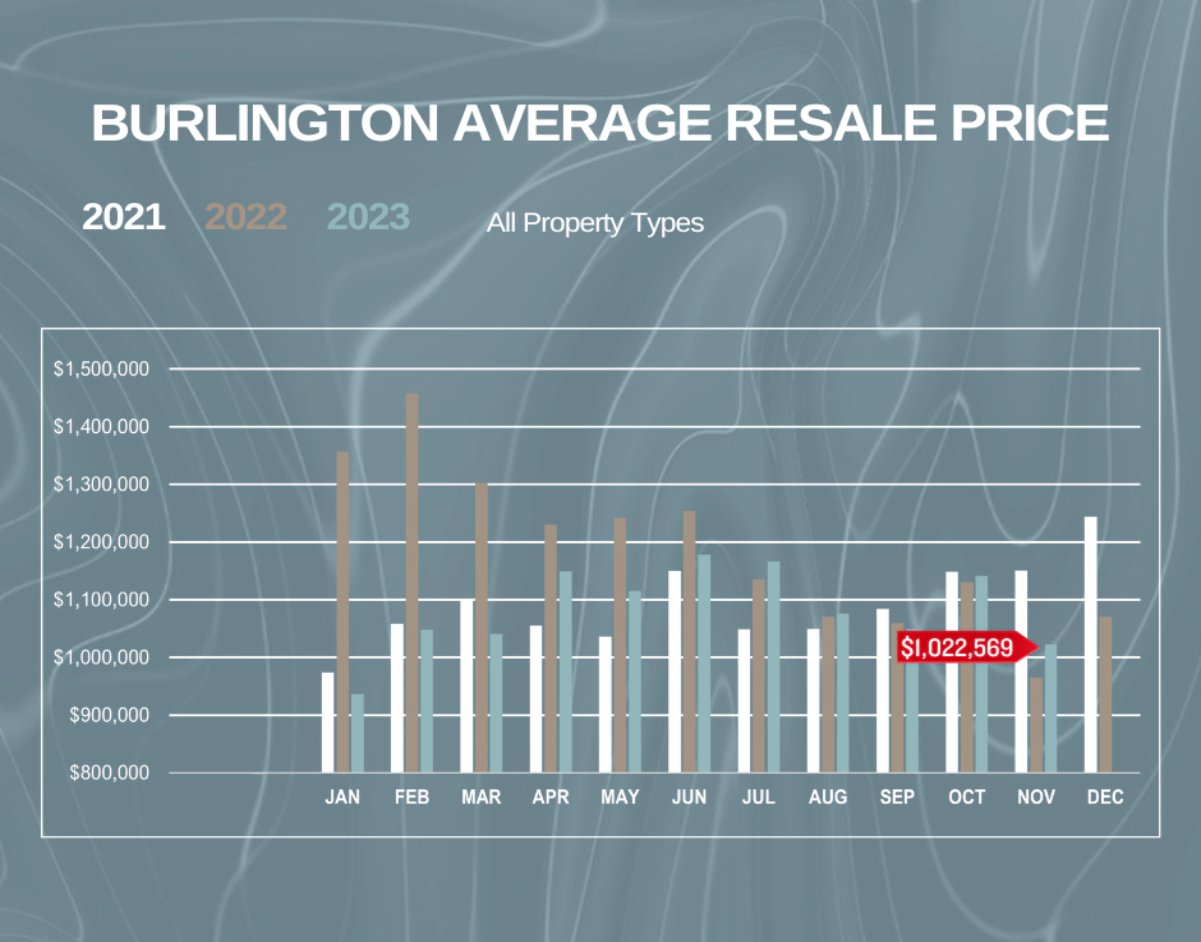
$1,022,569
Avg. Resale Price
november 2023 Stats
SALES
AVG PRICE
Detached
Semi-Detached
Townhouse
Condo Townhouse
Condo Apartment
69
4
9
31
27
$1,345,590
$854,000
$885,111
$751,781
$614,389
BURLINGTON Average Resale Price
